Ethereum Price Prediction: Golden Triangle Since 2017 To Send ETH Parabolic

Ethereum price is trading just below $2,200, with a macro chart prediction forming since 2017 signals the next move could be violent to the upside. An X analyst has flagged a golden triangle structure on ETH’s 3-week chart, a setup nearly a decade in the making that projects a parabolic rally above $12,000 by 2027–2028. The full target range may surprise even committed bulls.
The pattern is defined by two converging trendlines: a rising lower boundary anchored from the March 2020 Covid crash low and a flat upper resistance connecting the rally peaks of 2021, 2024, and 2025.
ETH has respected both boundaries repeatedly across multiple market cycles, with each touch producing a meaningful bounce. Currently, price is pressing the lower trendline again, forming what appears to be a higher low versus the 2025 bottom in a structure historically associated with breakout setups.
Separately, analyst CryptoFeras identified a rising diagonal support on the 3-day chart connecting cycle lows from 2022, 2023, and 2025, each of which preceded substantial multi-hundred-percent rallies.
Although the market backdrop complicates the picture, the Fear & Greed Index sits at 15–16, deep in extreme fear territory, while Ethereum’s deflationary supply dynamics and growing institutional flows via BlackRock’s ETHA provide structural support.
Discover: The best pre-launch token sales
Ethereum Price Prediction: $7,500 Before the End of 2026?
ETH is currently consolidating in the $2,000–$2,200 range following a sharp drawdown to $2,000 earlier this month. Volatility sits at 3.89% in a medium intensity level, with 60% green days across the trailing 30 periods, suggesting sellers are losing consistent momentum despite the fear-heavy sentiment.
Key levels define the near-term map. Support clusters at $2,162 (50-day SMA) and $1,760 (2026 year-to-date lows), with a deeper floor at $1,400 if macro conditions deteriorate sharply.
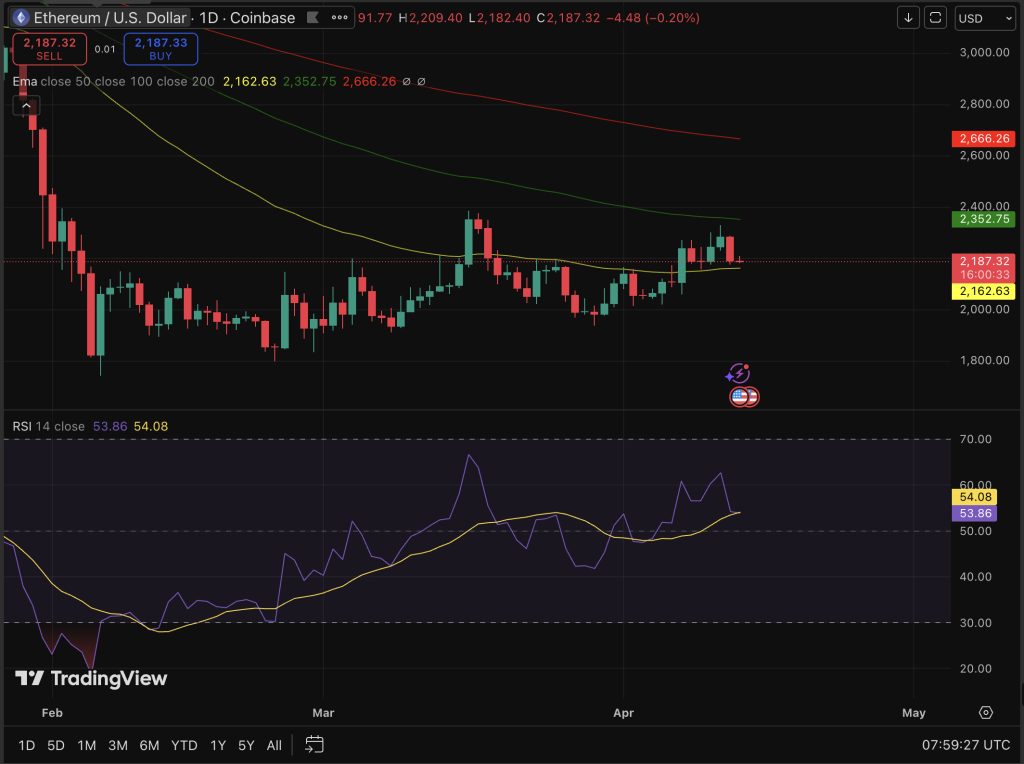
Resistance sits at $2,451 (5-day high) and $2,666 (200-day SMA), the latter being the critical reclaim zone for any sustained recovery thesis. RSI reads 54, neutral, but directional indicators on the daily and weekly timeframes are both flagging buy signals.
If ETH can hold $2,090 SMA support, it could reclaim $2,400, and the golden triangle breakout initiates a run toward Standard Chartered’s revised target of $7,500 by end-2026 and $15,000 by 2027.
The pattern is compelling. Whether price validates it in weeks or months remains an open question.
Discover: The best pre-launch token sales
Bitcoin Hyper Targets Early-Mover Upside as Ethereum Tests Key Levels
ETH at $2,100 offers meaningful upside potential, but reaching $7,500 still requires a 3.5× move from current prices, and Standard Chartered’s timeline stretches to late 2026. For some of us watching the crypto market structure and seeking asymmetric early-stage exposure, the current cycle is surfacing infrastructure plays operating at a fraction of established asset valuations.
Bitcoin Hyper is one generating notable presale traction. The project positions itself as the first-ever Bitcoin Layer 2 with SVM (Solana Virtual Machine) integration, delivering smart contract speed and programmability on Bitcoin’s security layer, targeting sub-second finality faster than Solana itself.
The presale has raised more than $32 million at a current token price of still just $0.0136, with staking available during the presale period. The core proposition addresses Bitcoin’s three structural limitations, like slow transactions, high fees, and absent programmability, without sacrificing BTC’s trust model.
The post Ethereum Price Prediction: Golden Triangle Since 2017 To Send ETH Parabolic appeared first on Cryptonews.