
Bitcoin Is Bouncing – But These 3 Metrics Decide If the Bull Market Is Returning

Bitcoin is rebounding, and it has returned to the higher structure of the high-$90,000 and low-$80,000 area after temporarily falling to the mid-$80,000s.
The shift has relieved short-term downside pressure, but market evidence indicates that the rally alone is insufficient to indicate that a new leg of a bull market is beginning.
Rather, analysts believe that the next step is whether a number of deeper regime indicators start to reverse to risk-on.
At the time of writing, Bitcoin was trading around $89,500, up about 1.4% over the past 24 hours.
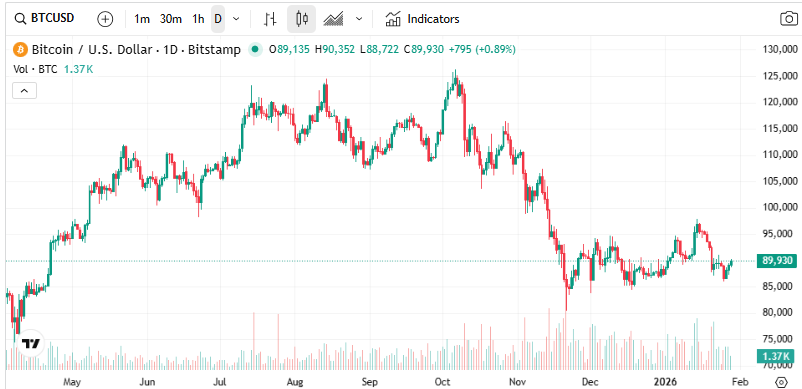
Bitcoin is down more than 7% over the last 14 days, showing sustained selling pressure that followed its retreat from record highs near $126,000 late last year.
While prices have been modestly higher over the past month, Bitcoin remains nearly 13% lower year to date and about 29% below its all-time high.
Bitcoin’s Long-Term Trend Remains Positive Despite Pullbacks
The first test for whether this bounce has durability lies in the broader trend structure.
Glassnode data indicates that Bitcoin continues to trade above its 200-day exponential moving average, which is a long-term metric that many institutions and macro-oriented traders pay close attention to.
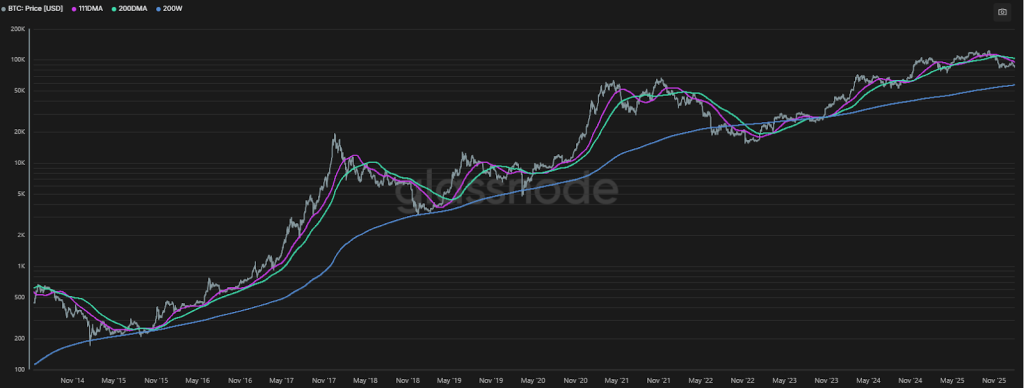
Trading above this level has been historically associated with structural bull markets, whereas trading below it has been bear phases.
The 200-day EMA is continuing to trend up, indicating that long-term demand has not yet disaggregated, and recent retreats seem to be corrective as opposed to an outright reversal.
ETF Flows Turn Cautious as Bitcoin Hovers Near Cost Basis
The second metric centers on demand, particularly from institutional investors through U.S. spot Bitcoin exchange-traded funds.
Since October 2025, ETF holdings have fallen by more than $6 billion, an 8% decline from peak levels, showing the first major stress test for this relatively new investor cohort.
On-chain data from CryptoQuant shows Bitcoin is now hovering close to the ETF realized price near $86,600, the average cost basis for ETF buyers.
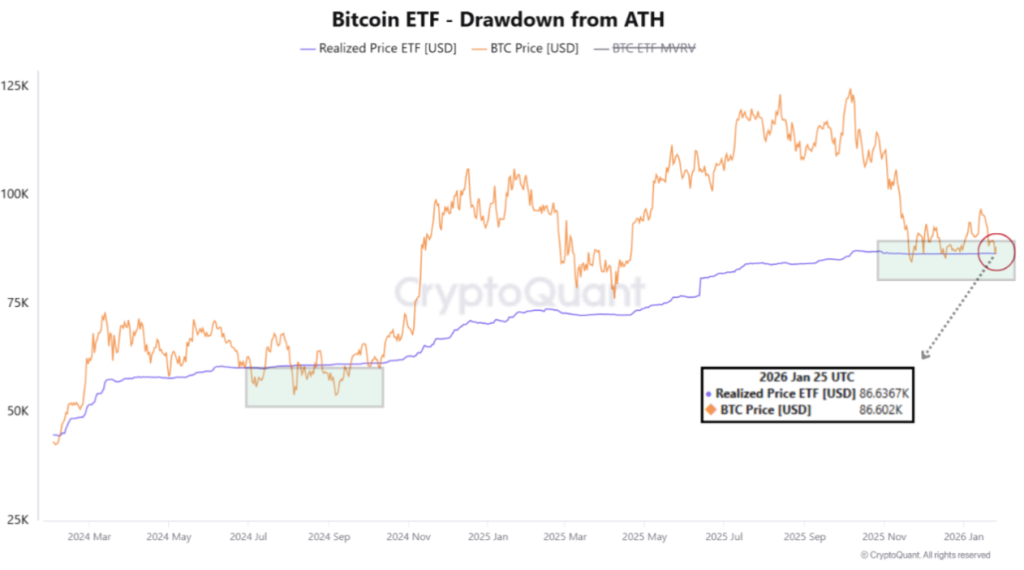
Analysts describe this zone as a psychological pivot, as staying above reinforces conviction and stabilizes flows, while trading below it has historically accelerated redemptions as investors lose their profit buffer.
While outflows have softened and ETF realized prices have remained relatively stable, inflows have yet to return in a sustained way, leaving institutional demand cautious rather than decisively risk-on.
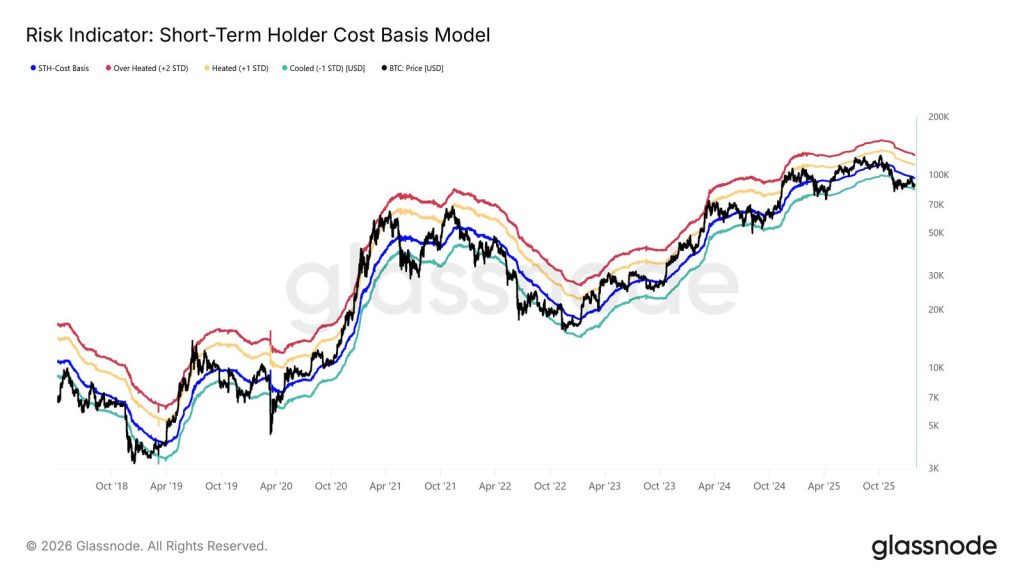
Short-Term Holders Hold the Line as Bitcoin Tests Key Levels
The third and arguably most sensitive metric is Bitcoin’s on-chain cost basis for recent buyers.
BitBo data show that Bitcoin still exceeds the Short-Term Holder realized price, which is estimated at the low end of the high-$60,000 to low-$70,000 range.
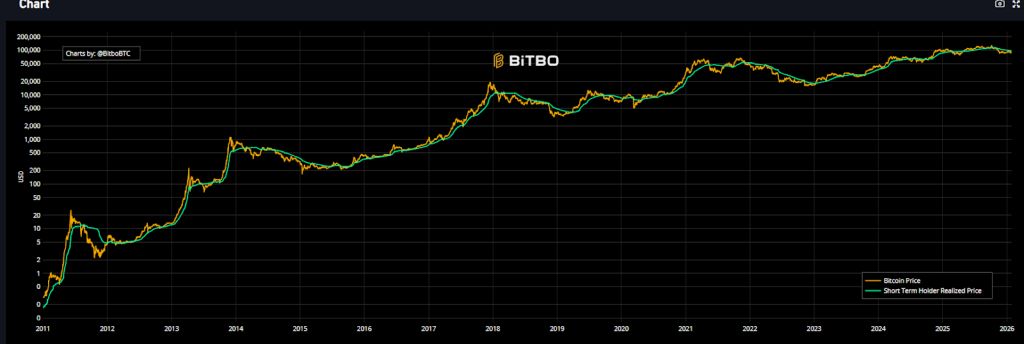
It implies that most new buyers are yet to be in profit, which makes panic selling less likely, and it will be easier to buy out dips.
Trading above this level has historically been consistent with the bull-market environment, and consistent breaks below indicated a transition into more serious bear markets.
Glassnode reported that this week, Bitcoin was unable to hold a move back towards the short-term holder cost basis around $96,500 and dropped into a shallow pullback, which is similar to the first phases of previous bear markets in 2018 and 2022.
However, only about 19.5% of short-term holder supply is currently at a loss, well below levels associated with broad capitulation.
Meanwhile, CryptoQuant analysts get concerned because the trend of Bitcoin supply held at a loss is upward, a pattern historically preceding deeper bear markets, even though prices are drifting down before ultimately stabilizing.
Early Bear Market Signal
“Historically, this shift has marked the early phase of bear markets, when losses begin to spread beyond short-term holders and gradually reach longer-term participants.” – By @Woo_Minkyu
Link
https://t.co/Y1HIXfUmLw pic.twitter.com/u9daSX9N4o
— CryptoQuant.com (@cryptoquant_com) January 28, 2026
Analysts also point to weakening on-chain demand, falling retail participation, and macro uncertainty, including concerns over U.S. liquidity conditions, as factors weighing on sentiment.
The post Bitcoin Is Bouncing – But These 3 Metrics Decide If the Bull Market Is Returning appeared first on Cryptonews.